Calibrating Your Force Sensor
The Pithon strain gauge / force sensor is calibrated for use by applying known weights to it and measuring its response in order to work backward from it. The weights are applied in an incremental, random, and/or cyclic loading profile over calibration time. A cyclic loading profile characterizes sensor behavior in terms of loading/unloading hysteresis, and a random loading profile minimizes the resulting effects.
Materials and Preparation
An untested force sensor with the following defaults from
mid_str_4T_sensing_and_elem.SLDPRT.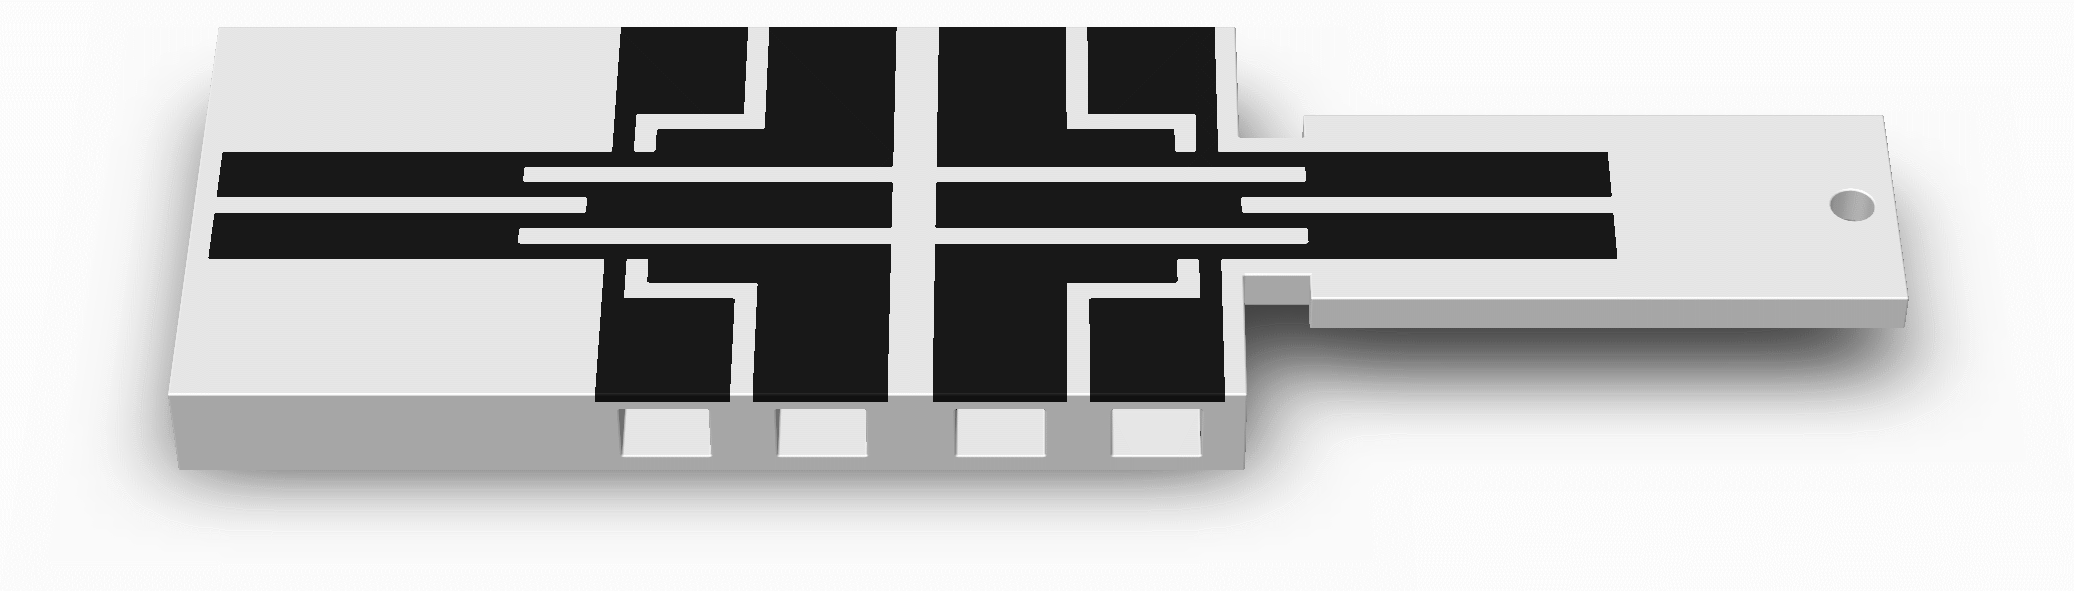
A hole close to the end of the cantilever beam (“Free End Hole” in the SolidWorks part) from which to suspend known weights
If you would like to use a force sensor that you have already printed without a free end hole, you can drill or punch a hole in the same place.
A similarly thick cantilever base to avoid unwanted deflection, emulating being embedded into your comparably large parent 3D printed structure
If you do not need spaces for the lower jaws of crocodile clips in a thick cantilever base, and would prefer it to lessen your print time, you can glue a thinner cantilever base to a piece of wood to be used as the cantilever base.
A reference set of conductive traces to correct for changes in temperature and humidity (recommended)
4-terminal sensing in each set of conductive traces (recommended)
Large electrical contact pads
Spaces for lower jaws of crocodile clips (optional)
An insulated double-ended crocodile clip jumper (or conductive paint/epoxy and lengths of thin wire stripped of their insulation on both ends) for each electrical contact
A table clamp/vice
Some string or more thin wire
A laboratory weight set or similar
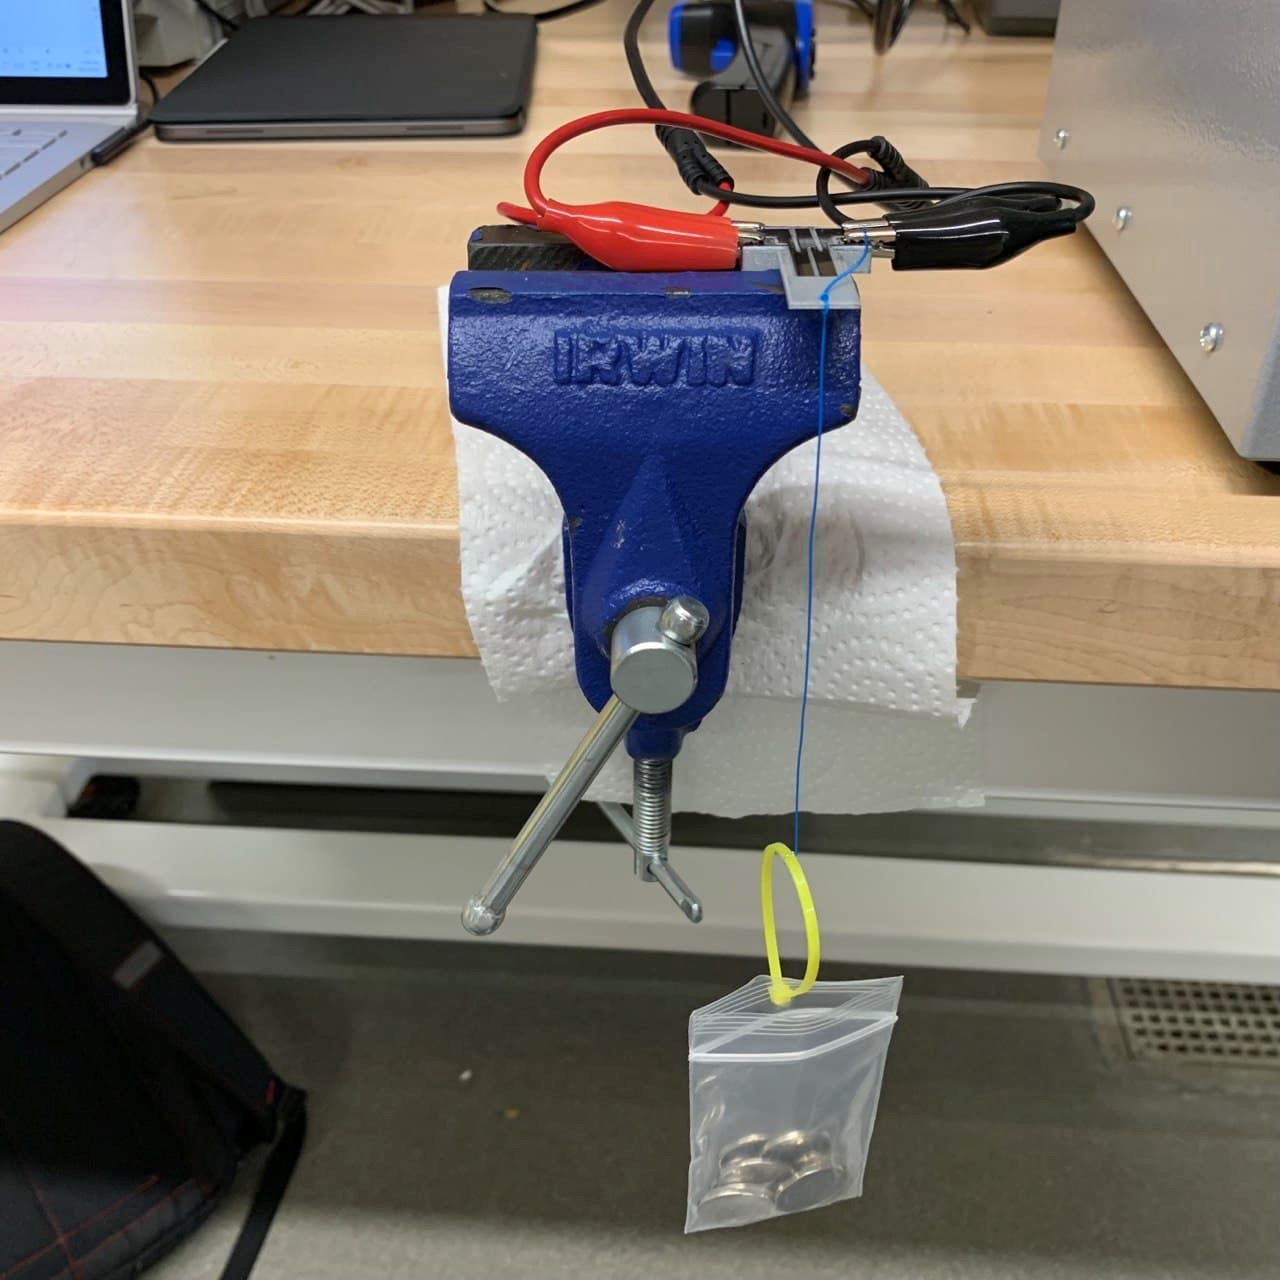
\(\uparrow\) A test rig of a force sensor that has a 1-mm cantilever beam and no reference set of conductive traces. Also shown are its crocodile clips, table clamp, and known weights in a pouch suspended by a wire from the cantilever beam’s free end hole.
Instructions
Note |
|---|
Many of the following tasks are no longer necessary or now semi-automated using the Pithon software for calibration data collection, preparation, and processing. |
Mount your clamp/vice on a table as shown above.
Clamp onto your force sensor’s cantilever base without the conductive traces being touched as shown above. Leave room for your crocodile clips if you are using them, room for the cantilever beam to bend downward, and room to suspend your weights from the cantilever beam’s free end.
Tie your string or spare wire securely to the free end hole as shown above. Ensure that its mass is nearly 0 grams beforehand.
Tie a loop at the other end of your string or spare wire.
If you are not using weights with hooks, hang a lightweight clear plastic pouch from the loop to hold them as shown above but without its weights. Ensure that its mass is nearly 0 grams beforehand.
Clip one end of your crocodile clip jumpers into the terminal slots, onto the surfaces of the electrical terminals as shown above (or follow the instructions in Preparing Electrical Contacts).
Now, assuming that you are using an Arduino microcontroller, open its IDE on your computer.
Follow 2-Terminal Sensing for Real-Time Data Logging Using a Microcontroller or 4-Terminal Sensing for Real-Time Data Logging Using a Microcontroller as applicable per set of conductive traces. Use the Arduino Serial Monitor, and make the following changes to the code under Instructions – Programming.
Immediately after
Serial.begin(9600), appendSerial.setTimeout(100);. This strikes a balance between a good sampling frequency (almost 10 per second) and stability over serial communication.Immediately before the end of the
loop()function, appendSerial.print(Serial.readStringUntil("\r\n"));. This will loop-back text that you enter in your serial monitor to log it for reasons that will become apparent.
Plug in your Arduino using its USB cable.
Upload your modified code to the board using the Arduino IDE, after which it will begin running onboard.
In your Arduino IDE, open the serial monitor. You should see lines of electrical resistance values (in ohms) updated in real time from your sensor using your Arduino.
Wait momentarily while recording data – say, roughly 100 samples. Be careful not to touch your sensor or its load.
Type “0 grams” into your serial monitor and Send this message to your Arduino and back (to record it conveniently in the same place) for the purpose of marking an upcoming change to the applied load. For example…
⁞
3833.33
0 grams
3877.55
⁞
Gently suspend the smallest weight – say, 4 grams – from the cantilever beam’s free end hole and wait briefly for your cantilever beam to settle under its new load.
Then, enter “4 grams” into your serial monitor. For example…
⁞
3884.76
4 grams
3877.55
⁞
Repeat the last 4 steps for further incremental sums of masses.
Unplug your Arduino. Your serial monitor will ‘freeze’.
Copy the partitioned runs of resistance data and save them into a text file, Excel workbook, etc. For example…
Column 1
⁞
3833.33
0 grams
3877.55
⁞
3884.76
4 grams
3877.55
⁞
Discard the resistance values between framed weight increments as being subject to the impulses of suddenly loading and unloading weights. For example…
Number of weights
Mass in grams
Resistance in ohms
⁞
⁞
⁞
0
0
3870.37
0
0
3851.85
0
0
3833.33
1
4
3877.55
1
4
3870.37
1
4
3851.85
⁞
⁞
⁞
Average the resistance values within framed weight increments as only being subject to measurement noise. For example…
Number of weights
Mass in grams
Resistance in ohms
Number of samples
0
0
3860.91
200
1
4
3866.34
54
2
8
3874.94
192
3
12
3877.61
165
4
16
3883.74
127
5
20
3889.58
3491
6
24
3896.26
127
7
28
3903.50
101
8
32
3912.05
138
9
36
3919.69
153
10
40
3931.75
272
Convert the masses (in units of grams) to force values (in units of Newtons) by multiplying them by 10 ≈ 9.81 m/s². For example…
Force in Newtons
Resistance in ohms
0.00
3860.91
0.04
3866.34
0.08
3874.94
0.12
3877.61
0.16
3883.74
0.20
3889.58
0.24
3896.26
0.28
3903.50
0.32
3912.05
0.36
3919.69
0.40
3931.75
Plot resistance against force. For example…
![Force Sensor Calibration Curve in Resistance [Ω] vs. Force [N]](https://raw.githubusercontent.com/keeganmjgreen/3D-Printed-Sensors-Development-Platform/main/img/Calibrating-Your-Force-Sensor/Force-Sensor-Calibration-Curve.png)